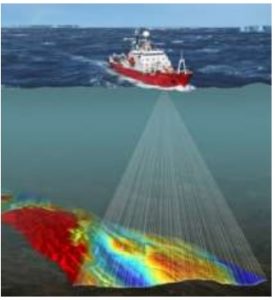
Hydrography involves measuring, describing, and mapping seas, rivers, lakes, and other bodies of water. In this Blended Learning course, you’ll learn the theory behind hydrographic surveying and become familiar with positioning, depth measurements, sonar, bathymetry, tides, water levels, accuracy, and the processing of hydrographic survey data. You’ll work with sample data from a hydrographic survey and use QGIS to process and visualize longitudinal and cross-sectional profiles, among other things. This will help you build a broad theoretical foundation before you specialize further or, during the 3-day Basic Hydrography course, head out onto the water yourself to conduct hydrographic surveys.
What is hydrography?
Hydrography is the field of study concerned with measuring, describing, and mapping seas, rivers, lakes, and other bodies of water. Hydrographers determine, among other things, water depths, the shape of the seabed, and the location of waterways, shorelines, and other features.
Hydrographic information is important for safe navigation, waterway management, coastal management, dredging operations, offshore projects, and the construction and management of maritime infrastructure. Reliable hydrographic measurements are also essential for monitoring changes in rivers, coastal areas, and riverbeds.
During this Blended Learning course, you’ll learn the theory behind hydrographic surveying. You won’t be conducting surveys on a boat yourself, but you will work with sample data from hydrographic surveys. Using QGIS, you’ll learn how to process, analyze, and visualize this data.
Positioning and Geodesy in Hydrography
A depth measurement is only useful if the exact location where the measurement was taken is also known. Positioning is therefore an essential part of hydrographic surveying.
You’ll learn how GNSS/GPS is used to determine the position of a vessel and surveying equipment. You’ll also be introduced to coordinates, reference systems, and the relationship between horizontal position, water level, and measured depth.
The geodetic basis of hydrographic surveying is also covered. You’ll learn why a reliable position and elevation reference is necessary to correctly compare measurements taken at different times and from different sources.
Measuring Water Depth with Sonar
Sound waves are used to measure water depths. You’ll learn the basic principles of sonar and echo sounders and discover how the travel time of a sound signal is used to determine the distance to the riverbed.
You’ll be introduced to single-beam and multibeam echo sounders and learn the differences between these measurement methods. Factors that influence the accuracy of depth measurements—such as the speed of sound, vessel movement, and sensor positioning—will also be covered.
Multibeam is covered in general terms within this Blended Learning course. Those who wish to specialize further in multibeam measurements can continue with the specialized course “Multi Beam Survey.”
Water Levels, Tides, and Depth Corrections
A measured water depth is not automatically a fixed depth. Water levels can change due to factors such as tides, river discharge, wind, and other hydrological and meteorological conditions.
You’ll learn why hydrographic depth measurements must be referenced to an agreed-upon reference plane and how water levels and tides affect the final result.
This will help you understand why a hydrographic survey involves more than just measuring the distance between a boat and the riverbed. Positioning, water level, reference plane, and depth measurement must all be considered together to obtain reliable bathymetric information.
Longitudinal and Cross-Sectional Profiles of a Waterway
An important application of hydrographic surveys is determining the shape and depth of a river, canal, or other waterway. Longitudinal and cross-sectional profiles can be measured for this purpose.
A longitudinal profile shows how the riverbed and water depth vary along the length of a waterway. Cross-sections, on the other hand, provide insight into the shape of the riverbed from one bank to the other.
You will learn how these profiles are set up, what data is required, and how the results can be used for applications such as waterway management, dredging operations, water management, and monitoring changes in the riverbed.
Processing Hydrographic Survey Data in QGIS
After covering the theoretical basics, you’ll work with sample data from a hydrographic survey. For this, we’ll use data from a survey that includes a longitudinal profile and several cross-sections of a waterway.
You’ll import the survey data into QGIS and combine position and depth data into usable geodata. You’ll visualize the measured points and profiles and examine how the depth and shape of the riverbed vary spatially.
In the process, you’ll also learn to assess the quality of the data and discover how hydrographic survey data can be combined with other geographic information.
Hydrography in Practice: The Apeldoorns Canal
During this Blended Learning course, you’ll work with sample data from a hydrographic survey of the Apeldoorns Canal. This will allow you to walk through the key steps of a simple hydrographic survey without having to go out on the water yourself.
You’ll work on assignments such as:
Preparing a hydrographic survey and determining what data is needed.
Checking and combining position and depth measurements.
Analyzing a measured longitudinal profile of the Apeldoorns Canal.
Processing various cross-sections and assessing the shape of the riverbed.
Importing and visualizing hydrographic measurement points in QGIS.
Identify depth variations and notable changes in the riverbed.
Compile the results into a clear map and hydrographic profiles.
By the end of the course, you will have a broad theoretical foundation in hydrography. You’ll understand how positioning, sonar, depth measurement, water levels, and reference systems come together in a hydrographic survey. In addition, you’ll be able to process, analyze, and visualize hydrographic survey data, as well as longitudinal and cross-sections, in QGIS.
Would you like to learn how to actually perform hydrographic surveys after gaining this theoretical foundation? Then you can continue with the 3-day Basic Hydrography course. On the third day, you’ll take a boat out onto the Apeldoorns Canal, measure a longitudinal profile and several cross-sections yourself, and process the collected survey data in QGIS.
You'll receive personalized guidance. After you register, our course coordinator will contact you to schedule your first session.
Learning Objectives
Understanding the Basics of Hydrographic Surveying
Explain how GNSS/GPS, sonar, and depth measurements work
Understanding and interpreting water levels, tides, and depth corrections
Analyze longitudinal and cross-sectional profiles of waterways
Processing and visualizing hydrographic survey data in QGIS
“`
Want to know more?
Do you have questions about the course content? Or are you unsure whether the course aligns with your learning goals or preferences? Would you prefer an in-company or private course? We’d be happy to help.
Hydrography is the measurement, description, and mapping of seas, rivers, lakes, and other bodies of water. Hydrographers determine, among other things, water depths, the shape of the seabed, and the location of waterways. Techniques such as GNSS/GPS, single-beam, and multibeam sonar are used for this purpose.
Surveying focuses primarily on measuring positions and elevations on land. Hydrography focuses on measurements on and under water. These fields have much in common: both utilize geodesy, coordinate systems, GNSS, accuracy calculations, and geodata. In hydrography, these are supplemented by sonar, water levels, tides, and bathymetry, among other things.
In the Netherlands, companies such as Fugro, Boskalis, Van Oord, Deep, N-Sea, Survey Noord, and Van den Herik are active in hydrographic and maritime surveying. There is a demand for new hydrographers and surveyors. Companies are looking for both experienced specialists and junior professionals and trainees. Boskalis, for example, has its own Survey department for hydrographic surveys, and Van Oord has a separate Survey discipline that conducts hydrographic and land surveys.
No. During the Blended Learning course, you’ll learn the theory and work with sample data from a hydrographic survey on the Apeldoorns Canal. If you want to actually learn how to take measurements, you can take the 3-day Basic Hydrography course. During the hands-on day, you’ll take a boat out onto the Apeldoorns Canal and measure a longitudinal profile and various cross-sections yourself.
Yes. You’ll use QGIS to view, process, and visualize hydrographic survey data. Among other things, you’ll work with position and depth data and analyze longitudinal and cross-sectional profiles. This will teach you how raw hydrographic survey data is converted into usable geoinformation.
Search the website
Find courses, MOOC content, articles and more in one place.