In today’s world, data plays a central role in how we make decisions, gain insights, and drive innovation. Data Science is at the forefront of this development. It builds a crucial bridge between raw data and actionable insights. This discipline lies at the intersection of statistics, computer science, and domain-specific knowledge. It enables us to unravel complex issues and discover patterns that would otherwise remain hidden. Using Python, data scientists unlock the potential of data by collecting, analyzing, and visualizing it. Whether it involves predicting consumer behavior, optimizing business processes, or contributing to scientific research, the possibilities are endless.
The demand for experts in this field is growing rapidly, as organizations of all sizes recognize how data-driven decisions can give them a competitive advantage. By embracing the power of Data Science, we open the door to a future in which our ability to understand and improve the world around us increases exponentially.
What is Data Science and why is it important?
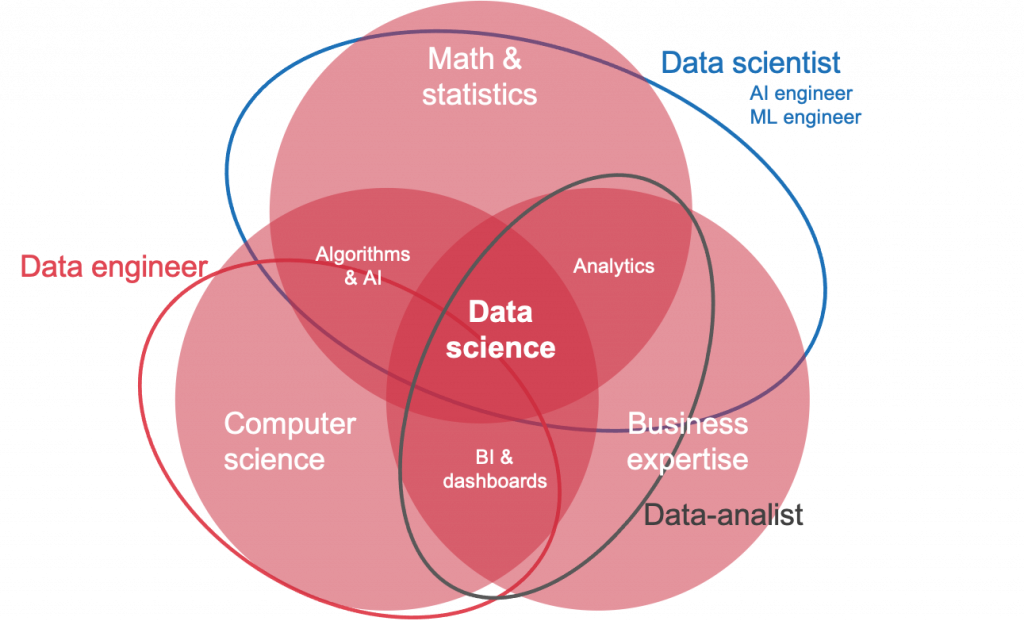
Data Science, at its core, is an interdisciplinary field that uses scientific methods, processes, algorithms, and systems to gain knowledge and insights from both structured and unstructured data. But why is this so important?
- Informed Decision-Making: Data Science provides the tools and techniques to filter, analyze, and extract meaningful insights from data. This enables companies to make informed decisions.
- Innovation and Development: Data Science plays a key role in driving innovation and development within companies. From improving customer service to developing new products
- Personalization: In retail, marketing, and many other sectors, Data Science makes it possible to analyze customer behavior and create personalized offers or services. This leads to better customer satisfaction and loyalty.
- Efficiency and Optimization: By analyzing processes and identifying operational inefficiencies, Data Science can help streamline operations and increase productivity.
Data Science is indispensable when dealing with geo-information and geodata. Analyzing spatial data aids in urban planning, environmental protection, and resource mapping. The skills you gain in the Python and Data Science course will not only enable you to work with this data but also to generate insights that can influence high-level decisions.
The Role of Python in Data Science
We’ve explored the importance of Data Science. Let’s now focus on the role of Python in this exciting field. Python has emerged as the lingua franca for Data Science, thanks to its simplicity, flexibility, and the rich collection of data analysis libraries it offers. But what makes Python so indispensable for data scientists?
- Accessibility and Versatility: Python’s simple syntax makes it accessible to beginners, while its powerful features meet the needs of experienced programmers.
- Rich Ecosystem: Python boasts an extensive ecosystem of libraries, such as NumPy for numerical computations, Pandas for data manipulation, Matplotlib for visualization, and Scikit-learn for machine learning. These tools are essential for performing data analysis and developing data science projects.
- Support for Machine Learning and Deep Learning: With libraries such as TensorFlow and PyTorch, Python is the preferred language for developing advanced machine learning and deep learning models. This makes it possible to extract patterns and insights from large datasets.
The Python and Data Science course at Geo-ICT makes optimal use of Python’s capabilities by teaching participants how to apply these tools to real-world data analysis challenges. By gaining practical experience with geoinformation and geodata, you can develop skills that are directly applicable across a wide range of sectors.
Python’s role in Data Science cannot be overstated. It serves as a powerful tool for unlocking the potential of data. This enables data scientists to build predictive models, gain insights, and support decision-making with quantitative evidence. Whether you’re just starting out with programming or already have experience, Python offers a solid foundation for a career in Data Science. This course is your springboard to success in this dynamic field.
What You’ll Learn in the Python and Data Science Course
Programming with Python: From Basics to Advanced Techniques
As you dive into the world of programming with Python, you’ll embark on a journey from simple scripts to complex applications. Python is known for its simple syntax, which makes it easier for beginners to get started. It’s designed to be readable and clear, with a focus on code readability. This not only facilitates the learning process but also makes collaboration and maintenance easier.
As you deepen your knowledge, you’ll discover that Python supports various programming styles—object-oriented, procedural, and functional programming—making it a flexible choice for many types of projects. This versatility attracts a wide range of developers, keeping the language vibrant and constantly evolving.
Python’s rich ecosystem of libraries and frameworks enables you to quickly work on a range of projects, from web applications to data analysis and machine learning. Frameworks like Django and Flask allow you to develop efficient web applications, while libraries like TensorFlow and NumPy are essential for advanced data analysis projects and machine learning.
As you progress, you’ll learn advanced techniques such as:
- List comprehensions for more efficient loops,
- Decorators to enhance functions without modifying their code,
- Lambda functions for anonymous function expressions,
- Object-oriented programming (OOP) for better code organization and reusability.
You’ll also learn about the importance of code and version control with tools like Git, which are essential for team collaboration and managing projects as they grow. Package management, with tools like Poetry, helps manage dependencies and ensure project consistency.
Data Analysis and Visualization: Working with Pandas and Matplotlib
When entering the world of data analysis with Python, Pandas and Matplotlib are two indispensable tools in your arsenal. Pandas is a powerful library for data manipulation and analysis, designed to make working with tabular data—such as you’d find in spreadsheets or databases—intuitive and efficient. Matplotlib, on the other hand, is the go-to library for data visualization in Python. It allows you to create a wide range of static, animated, and interactive visualizations.
Working with Pandas
Pandas offers data structures such as DataFrames and Series that make it easy to load, process, analyze, and visualize data. Some key features include:
- Easily reading and writing data from various file formats such as CSV, Excel, and SQL databases.
- Extensive functions for manipulating data, including filtering, sorting, and grouping.
- Powerful tools for performing statistical analyses and working with time series.
Visualization with Matplotlib
Matplotlib allows you to bring insights from your data to life through visualizations. Whether you need line charts, bar charts, scatter plots, or complex contour plots, Matplotlib offers the flexibility to create them. It works hand in hand with Pandas, allowing you to plot directly from DataFrames.
In-Depth and Applications
- Advanced Visualizations: In addition to basic charts, you can also create advanced visualizations with Matplotlib, such as 3D charts and geographic maps.
- Data Cleaning and Preparation: Before moving on to visualization, Pandas helps you clean and prepare your data. This is a crucial step in any data analysis process.
- Exploratory Data Analysis (EDA): With Pandas and Matplotlib, you can dive deep into your data, discover patterns, test hypotheses, and gain critical business insights.
The combination of Pandas for data analysis and Matplotlib for visualization offers a powerful toolset for data analysts and scientists. Whether you’re working on financial modeling, scientific research, or analyzing web traffic, these libraries enable you to extract insights from your data and communicate them in an understandable way.
Machine Learning: Introduction to Scikit-Learn
Machine learning (ML) is a powerful tool in modern data analysis and artificial intelligence. Scikit-Learn is one of the most popular and user-friendly libraries for ML in Python. Scikit-Learn provides access to a wide range of algorithms and tools for both supervised and unsupervised learning methods. This allows you to effectively identify patterns and make predictions based on your data.
Key Components of Scikit-Learn
- Datasets: Scikit-Learn includes several standard datasets, such as the iris and digits datasets for classification and the diabetes dataset for regression. You can use these to practice and understand ML concepts.
- Estimators: To perform ML tasks, Scikit-Learn introduces the concept of "estimators." An estimator is a Python object that provides the methods
fit(X, y) and predict(T) for learning from data and making predictions.
- Model Selection: Scikit-Learn offers tools for model selection, such as grid search and cross-validation, to find the best parameters for your model and evaluate its performance.
Practical Applications
Scikit-Learn is widely used for various applications, including but not limited to:
- Classification: Identifying the category to which an object belongs. This is commonly used in spam detection and image recognition.
- Regression: Predicting a continuous value associated with an object, such as stock prices or drug responses.
- Clustering: Automatically grouping similar objects into sets, which can be useful in customer segmentation and grouping experimental results.
Getting Started
To get started with Scikit-Learn, you need to familiarize yourself with the basic steps of loading a dataset, choosing an estimator (model), training this model on your data, and making predictions. The process begins by importing the necessary modules and loading your dataset. Next, you select a model and adapt it to your data using the fit method. Finally, you use the trained model to make predictions on new, unseen data.
Scikit-Learn’s design is structured and intuitive, making it an excellent starting point for anyone interested in machine learning. Whether you’re a beginner or an experienced data scientist, the library provides a solid foundation for developing and expanding your skills.
For more detailed information and tutorials, you can consult the official Scikit-Learn documentation. It contains comprehensive guides and examples to help you navigate and apply machine learning with Scikit-Learn.
Why choose our Python and Data Science Course?
Choosing our Python and Data Science course at Geo-ICT means taking an in-depth dive into the essential tools and techniques for data analysis and machine learning. This four-day course combines theory and hands-on exercises to develop your skills in Python programming, data manipulation with Pandas, numerical computations with NumPy, and data visualization with Matplotlib. You will also learn practical applications of machine learning using the Scikit-Learn library. The curriculum is designed not only to impart knowledge but also to enable you to apply this knowledge in your own projects and work, with an emphasis on independent analysis and the use of Jupyter Notebooks for an interactive development experience.