
This course is intended for employees who want to learn how to use QGIS with marine data.
Everything about QGIS
This course is intended for employees who want to learn how to use QGIS with marine data.
In today’s world, geographic information plays a crucial role in nearly every aspect of our daily lives and work—from navigating with our smartphones to managing natural resources and planning urban development. Geographic Information Systems (GIS) are the invisible backbone that supports these complex processes. But what exactly is GIS? Essentially, GIS combines software, hardware, and data to collect, manage, analyze, and visually represent spatial and geographic information. These systems enable us not only to see the world around us as it is, but also to understand it and plan for how it could be.
GIS technology is invaluable to various sectors, including environmental protection, utilities, healthcare, government services, transportation, and even marketing. What makes GIS unique is its ability to present data not just as numbers and words, but as a dynamic map that offers interaction and insight. This makes it possible to identify complex relationships, patterns, and trends that would otherwise remain hidden in traditional data analyses.
One of the most popular and accessible GIS tools is QGIS. As open-source software, QGIS offers users a rich set of features for data analysis and visualization—without the high costs often associated with commercial GIS software. QGIS supports a wide range of file formats and standards. This makes it a flexible choice for projects of any size—from simple maps for personal use to complex geographic analyses for large organizations.
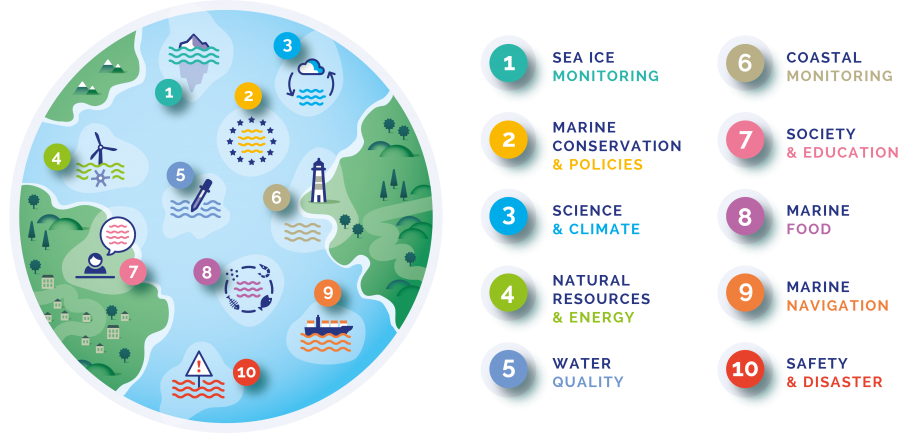
In the context of marine data, QGIS offers specific tools and plugins that are essential for the study and management of marine and coastal ecosystems. QGIS enables researchers, policymakers, and environmentalists to understand and protect the marine environment in unprecedented ways.
No experience with QGIS yet? Then we recommend starting with the QGIS basics course.
GIS is a powerful tool that helps us understand, analyze, and organize the world around us through the use of geoinformation. These systems make it possible to visualize, manipulate, analyze, and present spatial and geographic data in the form of maps, graphs, and reports. GIS plays an essential role in many sectors, including urban planning, environmental management, transportation, and healthcare, by providing insight into spatial patterns and relationships.
A particularly powerful aspect of GIS is its ability to overlay different datasets to analyze complex issues. Imagine you want to investigate the impact of climate change on coastal areas. With GIS, you can overlay layers of sea-level rise, population density, and ecological sensitivity to identify risk areas and advise policymakers on preventive measures.
QGIS, a leading open-source GIS software, makes these advanced analyses accessible to everyone. It offers a wide range of functionalities, from basic map creation to complex spatial analyses, and is supported by an active community of users and developers. Thanks to its user-friendliness and extensive documentation, it is an excellent starting point for anyone who wants to learn how to work with GIS.
In the context of marine data, QGIS offers specialized tools and plugins that are invaluable for the research and management of our oceans. The ability to analyze large datasets of ocean observations, such as temperature, salinity, and currents, helps scientists understand and protect the dynamics of marine ecosystems. By visualizing this data with QGIS, we can understand the complexity of the ocean in new ways and appreciate the crucial role it plays in our global climate system.
In the era of climate change and increasing pressure on our oceans, understanding and protecting marine ecosystems is more urgent than ever. GIS plays a crucial role in this, as it enables us not only to visualize complex marine data but also to analyze and interpret it.
Marine data is inherently spatial and dynamic. This makes GIS’s ability to reveal and model spatial patterns particularly valuable. With GIS, for example, scientists and policymakers can track the spread of invasive species, model changes in ocean currents that affect the climate, or assess the impact of sea-level rise on coastal communities.
GIS functionality extends to supporting the planning and implementation of marine protected areas (MPAs). Spatial analyses can identify areas critical for biodiversity conservation, helping to prioritize conservation efforts.
QGIS enables researchers to perform advanced analyses and visualizations specifically for marine data. The ability to process netCDF files and the availability of plugins such as the Point Sampling Tool and Contour plugin make it an ideal choice for working with marine datasets. These tools enable users to create detailed maps that display surface temperatures, salinity, ocean currents, and other key marine variables.
In conclusion, the integration of GIS into the study and management of marine data offers powerful capabilities for monitoring, understanding, and protecting our oceans. By mapping the complex relationships and processes that shape our marine environments, GIS contributes to the development of solutions that are both ecologically sustainable and economically viable. This ensures a healthy future for our oceans.
As you explore the marine world with QGIS, you’ll encounter a number of basic techniques and concepts that are essential for successfully navigating and analyzing geodata. Understanding these fundamentals is crucial to fully harnessing the power of QGIS. Let’s dive into some of these basic principles:
Here are some essential techniques you need to master:
These basic concepts and techniques form the backbone of your QGIS skills, especially when working with marine data.
QGIS is not only powerful for basic tasks but also excels in advanced features that are crucial for in-depth analysis and visualization of geoinformation. These advanced capabilities enable users to manipulate and analyze complex geographic data. This opens up new insights and solutions for challenges within marine and other geo-related fields.
These advanced features enable users to perform in-depth analyses, create custom visualizations, and address complex geographic issues with a high degree of precision and flexibility. Whether studying marine ecosystems, planning urban developments, or analyzing environmental impacts, QGIS provides the tools needed to draw insightful conclusions.
Choosing the right course to master QGIS and marine data analysis is crucial for both professionals and enthusiasts in the geoinformation sector. Our QGIS Marine Data Course stands out through a unique combination of expertise, practical application, and accessibility. But why should you choose our course specifically? Here are the reasons:
By choosing our QGIS Marine Data Course, you’re not just choosing to learn a software package. You’re choosing a comprehensive educational experience that takes your skills, knowledge, and career in geoinformation technology to the next level. Take the leap today and embark on a learning journey as deep as the oceans you’ll learn to analyze and protect.

Do you have questions about the course content? Or are you unsure whether the course aligns with your learning goals or preferences? Would you prefer an in-house or private course? We’d be happy to help.
This course provides in-depth knowledge and skills for working with QGIS, with a specific focus on the processing and analysis of marine data. From the basics to advanced techniques, the course is designed to fully equip professionals in the geospatial sector with the tools they need for marine projects.
The course is ideal for aspiring geospatial specialists, experienced geospatial professionals, companies in the geospatial sector, people seeking career transitions, and educational institutions looking to expand or refresh their knowledge of QGIS with a focus on marine data.
Topics include an introduction to QGIS, marine GIS techniques, ocean data analysis, marine data processing, advanced QGIS features such as data visualization and 3D map modeling, as well as hands-on projects and case studies.
The course spans two days, with each session designed to provide both theoretical knowledge and practical skills, including hands-on project work.
The cost of the course is €1,095, excluding VAT. This includes all course materials, access to software, and personalized guidance from experienced instructors.
Yes, upon successful completion of the course, you will receive a certificate from the Geo-ICT Training Center in the Netherlands, confirming your skills in QGIS and marine data analysis.